In all of my years of instrument flying, there’s nothing more inspiring than climbing up through a cloud deck to bust out on top into a clear blue sky or bright full moon illuminating an endless sea of clouds below. If that weren’t enough, flying a couple thousand feet over the cloud deck all the way to your destination is majestic, in of itself, especially when the sun is low in the horizon.
Besides the amazing view, the bonus is often glassy-smooth air with no airframe icing and unlimited visibility. So, it is no surprise that for many pilots knowing that magic altitude that keeps you comfortably on top is like a search for the Holy Grail.
If you’re not already a subscriber, what are you waiting for? Subscribe today to get the issue as soon as it is released in either Print or Digital formats.
If I look at my blog’s search statistics over the last few years, “cloud tops” is perhaps the most commonly searched phrase. A good estimation of the cloud tops is like the finest gold, especially pilots flying under IFR during the winter months. The bad news is that there are very few weather products that clearly depict the height of these tops. Unless there’s a recent pilot report or two in the area, actual cloud top heights must be inferred by examining and often integrating several weather sources. Even then, there’s no guarantee you’ll have the right answer with any degree of certainty.
Quantifying Uncertainty
You can’t have a discussion about the height of the cloud tops unless you discuss the importance of quantifying uncertainty. The National Weather Service (NWS) quantifies uncertainty by issuing probabilistic forecasts. In other words, NWS meteorologists are rarely 100 percent certain of a particular weather event occurring. So, they use a probabilistic approach to quantify and communicate their uncertainty. However, a forecast for a 30 percent chance of showers and thunderstorms tends to bother a lot of pilots.
You might say that popping out on top of the top of a cloud deck into clear air is essentially a binary condition. You’re either in the cloud or you’re not. Unfortunately, the NWS observation network and forecast prowess isn’t quite able to duplicate this binary event that will give you confidence.
In other words, when looking at the weather guidance prior to a flight, you may be nearly certain that at 3,000 feet you will be in the cloud. Conversely, at 6,000 feet, you may be nearly certain you will be in clear air above the cloud. Therefore, the farther above 3,000 feet, the more certain it becomes that you will be in clear air and above the cloud top. This creates a layer of uncertainty as to where the cloud stops and clear air begins. In some circumstances it may be 5,000 feet of uncertainty and in others it may only be only 1,000 feet of uncertainty. It simply depends on the weather environment and the data available to make that determination.
Observations Versus Forecasts
Saying that the NWS observation network is limited would be a gross understatement. There are very few sources of actual atmospheric data that can help you identify the altitude where the tops exist with any certainty. Using observational sources like pilot reports, radiosonde observations, and various satellite images are the most accurate way to identify the actual cloud tops. Remember though, these sources are just a glimpse of the recent past. The older the observation, the less likely it will be representative of the tops, especially if the weather is changing rapidly.
If these sources are not available or they are inconclusive, you are stuck using numerical prediction model analyses, which are also a glimpse of the recent past. Of course, in most cases pilots are not as interested in what happened an hour or two ago but are more dependent upon the height of the tops in the next three or four hours. For that, you must rely on near-term forecast guidance. For those pilots that want miracles, it is either incredibly difficult or fundamentally impossible to consistently predict the tops of clouds with any certainty more than six hours in advance.
The Big Picture
Before you start diving in to determine the height of the clouds, take the time to get a sense of the “big picture” or what meteorologists refer to as the synoptic-scale weather. A front moving through your proposed route may produce tops that are changing by the minute. On the other hand, upslope flow in the Central and High Plains may produce a very flat-topped and highly capped stratus deck that changes little throughout the day. Also pay close attention to the diurnal changes. The afternoon sun can deepen cumuliform-type clouds or erode a ground-hugging stratus deck.

Pilot Weather Reports
Pilot weather reports, or more simply PIREPs, are perhaps the best source for tops when they are available and near your proposed route of flight. Of course, pilot weather reports are rather scarce early in the morning or later in the evening. Reports of the height of the cloud tops are even scarcer. However, they still represent the best observational data available to pilots.
PIREP tops are always reported in reference to mean sea level (msl). By the way, don’t forget to look at the remarks section for more nuggets of information about the tops. Here’s an example of a PIREP from the pilot of a Cessna Caravan that includes a report of ragged tops at 5,000 feet with a higher layer above: ERI UA/OV ERI270015/TM 1251/FL050 /TP C208/SK OVC026-TOP050/TA 00/IC MOD CLR/RM TA 02 040 TOP RAGGED HYR LYR ABV.
PIREPs have a very short shelf life, especially when the weather is changing quickly. A report older than an hour may be obsolete by the time you hop in the plane and depart. Keep the age of these reports in mind and always look for updates.
RAOBs
The NWS launches weather balloons, also known as radiosondes, twice a day at 1100Z and 2300Z at 92 locations throughout the U.S. and its territories (see weather.gov/upperair/nws_upper). Now tracked using GPS, radiosondes measure the actual temperature, dew point temperature, and wind speed and direction as a function of pressure as the hydrogen-filled balloon ascends skyward well into the lower stratosphere (nearly 100,000 feet) before it bursts and parachutes back to Earth. This data is collectively called a radiosonde observation (RAOB) and, when plotted on a thermodynamic chart such as a Skew-T log (p) diagram, is colloquially referred to as a temperature sounding. The latest soundings plotted on a Skew-T log (p) diagram can be found on a clickable map here (vortex.plymouth.edu/mapwall/upperair/raob_conus.html).
RAOBs are not an analysis or forecast. They represent actual atmospheric data. There’s nothing superior to this kind of data short of a pilot report. The key is to examine the temperature dew point spread or what meteorologists refer to as the dew point depression. As the balloon ascends from below into a nonprecipitating warm cloud (cloud top temperature warmer than minus-12 degrees Celsius), the dew point depression normally approaches zero, indicating saturation. And when the balloon pops out on top of the cloud into clear air, the dew point depression should begin to increase.
How much of an increase depends on how dry or moist the air is above the cloud. If there’s a wind shift at the cloud top, normally the increase in the dew point depression is fairly dramatic (the winds above have shifted to a dryer source region). If the clouds are capped by a temperature inversion (as it is for a stratocumulus cloud deck), there’s usually a dramatic increase in the dew point depression. The inversion essentially caps or limits the growth of the clouds. And when the increase isn’t significant, it leaves some uncertainty as to where the tops are actually located (sometimes that’s the case for ragged tops).
There are times where there will be a lot of uncertainty and the sounding may be inconclusive. This is especially true for cold clouds (cloud top temperatures colder than minus-12 C). This is because the air is super saturated with respect to ice, not liquid water. So, the dew point depression isn’t necessarily a good way to measure saturation. The frost point instead of the dew point would be better, but that’s not displayed on many thermodynamic charts.
The top of a cumuliform-type cloud deck can be a little more difficult to determine since a field of cumulus clouds are sometimes highly variable in height. Say, for example, a scattered to nearly broken field of cumulus clouds exists over the radiosonde station. If the radiosonde ascends through a towering cumulus cloud, you’ll likely see a very deeply saturated atmosphere presented on the sounding. Whereas if you consider that same radiosonde ascending in between these cumulus clouds, you might see a rather dry sounding as the result.
The more serious issue with using RAOBs is the coarse temporal and spatial resolution of the data. Radiosondes are ordinarily launched twice a day. Moreover, these stations are so spread out that, even if you plan to depart a little after 1400Z or 0200Z (when the RAOB data becomes available), there’s a good chance it may not be very representative of the tops along your route. (see weather.gov/upperair/nws_upper). However, it still may be useful when the conditions within the area are somewhat homogeneous. But you’ll need other sources of data to come to that conclusion.
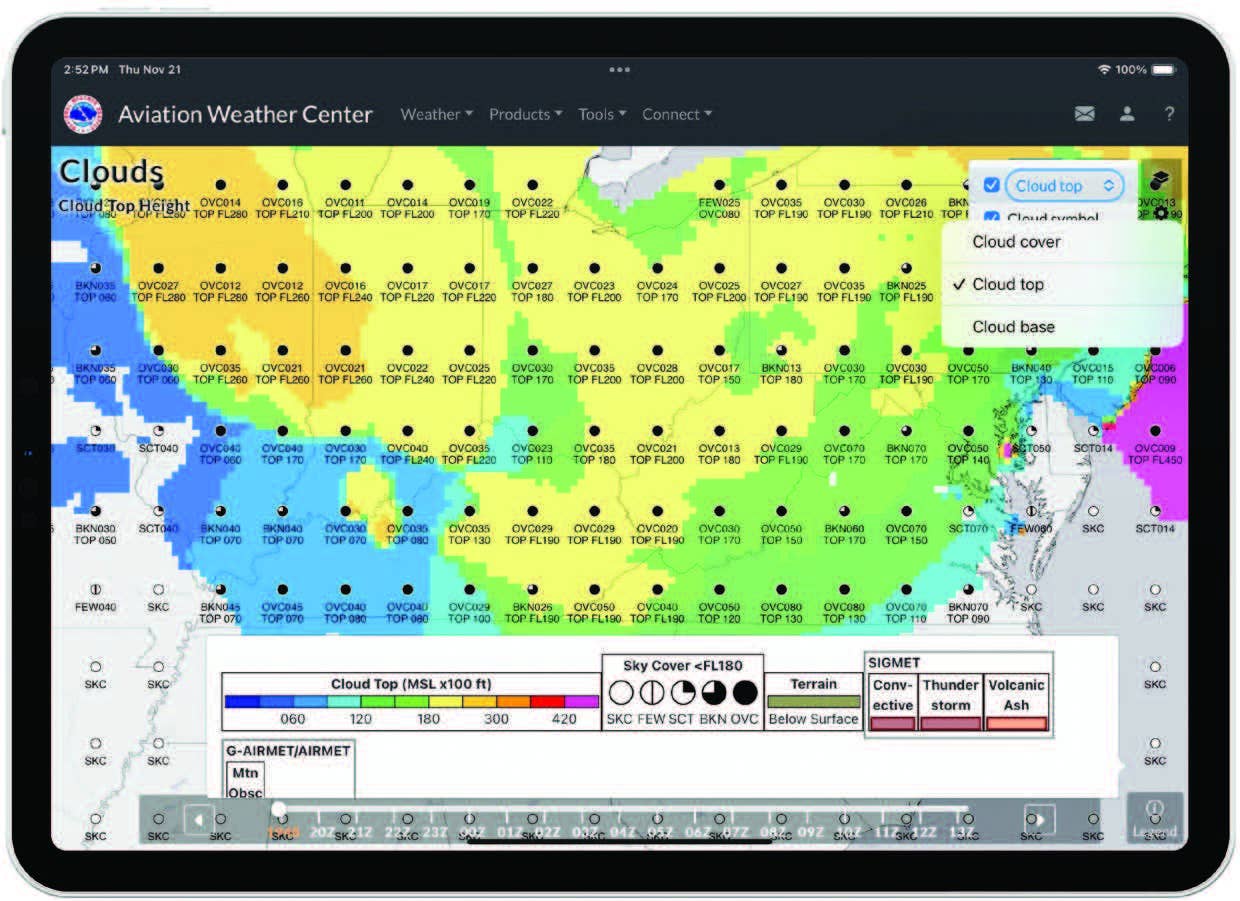
(Visit aviationweather.gov/gfa/#clouds) [Courtesy: Scott Dennstaedt]
Forecast Soundings
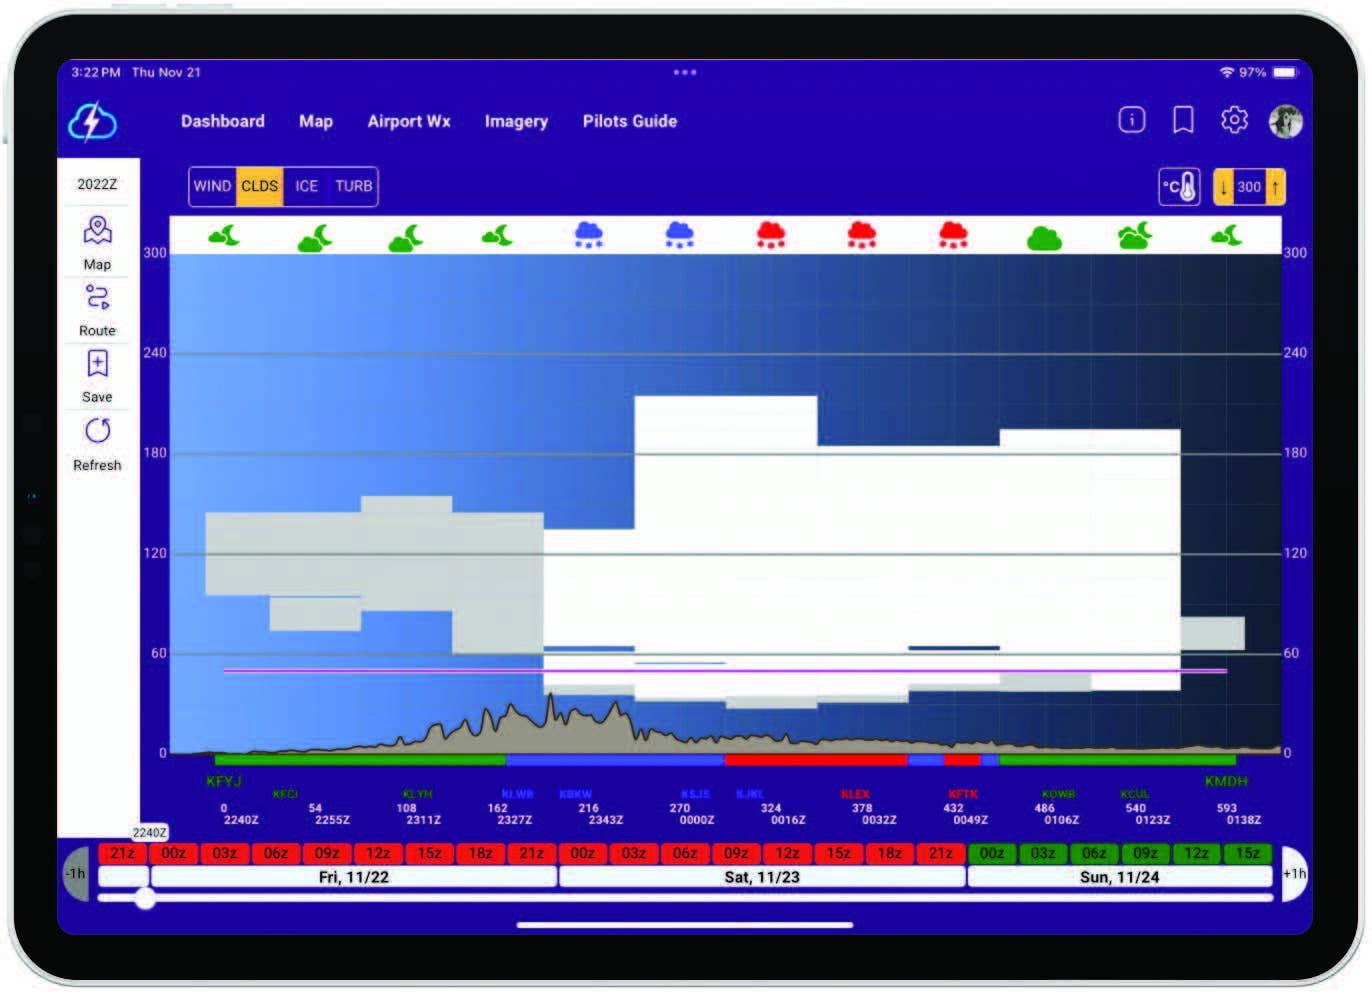
Even though radiosondes are only launched twice a day at locations that are widely spread throughout the country, forecast models such as the High-Resolution Rapid Refresh (HRRR) model are refreshed hourly and data similar to a RAOB is available with a resolution as good as 3 kilometers (1.6 nm). I have to emphasize that this is not an observation using sensors like a radiosonde. It is data from a numerical weather prediction model that is based on a score of surface-based and upper-air observational data collected hourly. Nevertheless, you can expect more uncertainty and inherent forecast errors in this data.
Interpreting a forecast sounding is similar to a ROAB, except when determining the tops of cumuliform-type clouds. The HRRR or any model should never be expected to predict every cumulus cloud—even large ones. Expect the forecast sounding to represent the environment that cumulus clouds can develop and grow within. This exercise requires that you understand what is called “parcel theory” to lift an air parcel. This is to determine if the conditions are favorable for cumulus cloud development to understand how far the parcel could potentially rise within the environment presented in the forecast sounding. It’s essentially a what-if game.
Often in this situation you can only determine the maximum growth of the clouds at any particular time. When there’s a significant amount of instability present, the answer might be growth to FL 450—not an answer that is always very helpful except to say that deep, moist convection may be likely. For those that don’t want to learn how to use a thermodynamic diagram, the Aviation Weather Center (AWC) website does provide a cloud tops forecast as part of the Graphical Forecasts for Aviation (GFA). It uses the HRRR forecast model for regions over the conterminous U.S.
Satellite Images
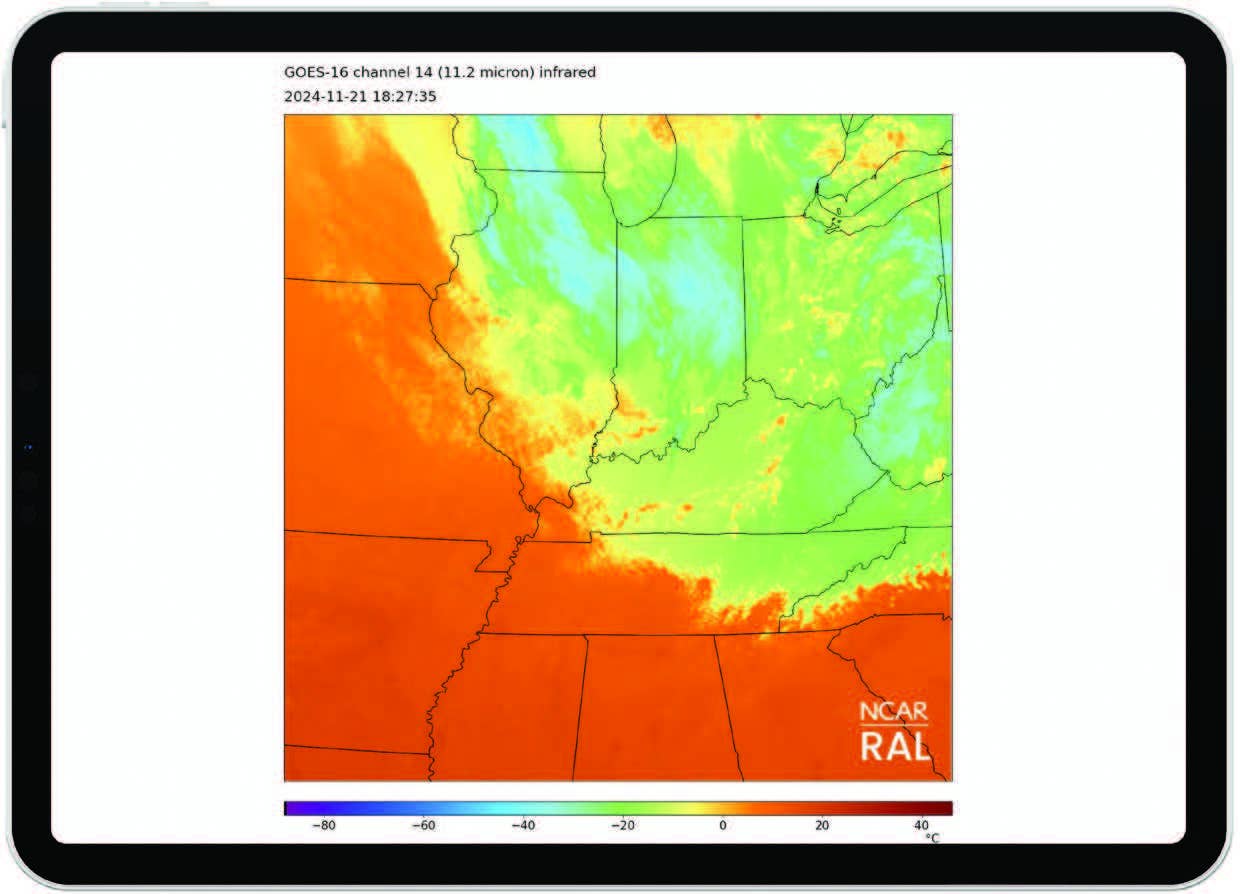
There are many flavors of satellite images to include visible, infrared and water vapor. Geostationary satellite images (such as GOES) are usually available at 15-minute intervals. Each relies on a different set of wavelengths emanating from the cloud or vapor present in the atmosphere. Visible imagery is useful to determine the extent of the cloud cover and higher-resolution images may provide some clue as to the shape or texture of the tops. In other words, you may be able to tell the difference between a broken cumulus field of clouds versus an overcast stratus deck.
A longwave color infrared satellite image will become your best friend to determine the tops of a cloud deck. Each color represents the temperature of the cloud top. Simply find the corresponding temperature using the color scale on the chart. Find a nearby RAOB, forecast sounding, or analysis and correlate the temperature with an altitude. It’s that easy…well, almost.
Keep in mind that when the sky is clear, some of the colors you see on the image could represent the temperature of the surface (land or ocean) that could include snow on the ground. Also, low clouds and radiation fog will often have the same temperature as the surface making it difficult to determine the extent of clouds. During the day, you can easily determine this by comparing the visible satellite image or surface observations (METARs) with the infrared image. Also note that during the cold season snow on the surface will look a lot like clouds on the visible satellite image.
Never Rely on a Single Source
I’m sure you remember a discussion with your instructor about relying too much on one single instrument while in instrument meteorological conditions. When that instrument fails, you may get burned. Similarly, when determining cloud tops, you should always arrive at an answer from using multiple sources as discussed here. Don’t put your faith in one single weather product. Every single-source weather product has its limitations, including pilot weather reports. You’ll get your highest quality answers when all of the weather guidance is conflated into one clear estimate of the tops.
Last, but not least, this discussion only scratches the surface with respect to determining the height of cloud tops. There are other methods and guidance that can be used such as asking air traffic control for any tops reports. The Velocity Azimuth Display (VAD) Wind Profile (VWP) generated by WSR-88D NEXRAD Doppler can sometimes be used to determine the height and thickness of stratiform cloud layers. G-AIRMETs issued by forecasters at the AWC for airframe ice can also provide a clue where the top of a nonconvective icing layer is located. Finally, echo top heights may also provide some clues but only show the top of the precipitation core, not cloud tops.
This feature first appeared in the February Issue 955 of the FLYING print edition.
Credit: flyingmag.com